
And why we use it in problem solving.
If you’ve been in corporate for a while, you will have heard about the ’80/20-rule’. Many managers and executives throw it around, many of them not knowing exactly what they are talking about.
What is the 80/20-rule?
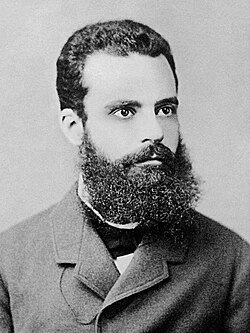
The 80/20-rule, also known as the Pareto Principle, is a rule of thumb in statistics. It roughly means that in many situations not everything is equally distributed. It was described by Mr. Vilfredo Pareto in the nineteenth century. He discovered that in Italy, 80% of the land is owned by roughly 20% of the (wealthiest) people. When he looked beyond this topic, he found a general rule of thumb that 80% of the perceived ‘issues’ track back to roughly 80% of the ’causes’. In other words, if you want to find the causes for an socio-demographic/economic phenomenon, there are a few main causes. In modern business english, people will call this ‘focus on the critical few’… or ‘the big rocks first’.
Other examples are that 20% of the kids in a kindergarten class make 80% of the noise. 80% of the complaints will come from the same 20% of customers. The top 20% of your sales people bring in 80% of your revenues.
The 80/20-rule does not always mean 80% and 20%
The Pareto principle is a rule of thumb, not a mathematical law. Observe your data carefully and sometimes you might find 90/10, 87/16 or 95/15. It’s directionally around the idea that distribution is not equal with a few large contributors. Also note that 80/20 doesn’t have a sum of 100%. You can have a situation where 90% of the taxes are paid by 13% of the population. These are two different numbers/dimensions, so they don’t have to add up.
How to use Pareto in Problem Solving
Problem Solving, if anything, for a large part is about observing a phenomenon you were not expecting and trying to understand it. In that way, to not get lost in all details and possible variations, it’s good to keep the Pareto Principle in mind. Probably there are small set of things going on, causing the largest part of your gap.
So, after going to gemba and looking at the data, you group your issues on it’s contribution, and just look for the biggest ones.
A pareto chart in problem solving is a histogram of where and why the gaps are occurring. So it’s a frequency chart, also known as a histogram, sorted from largest to smallest contributor.
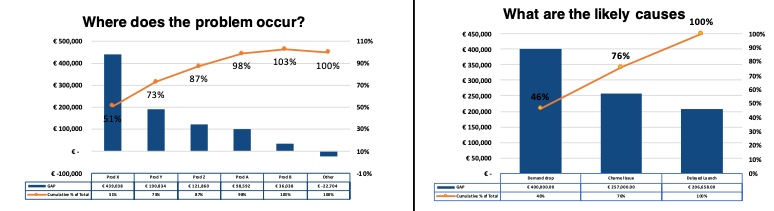
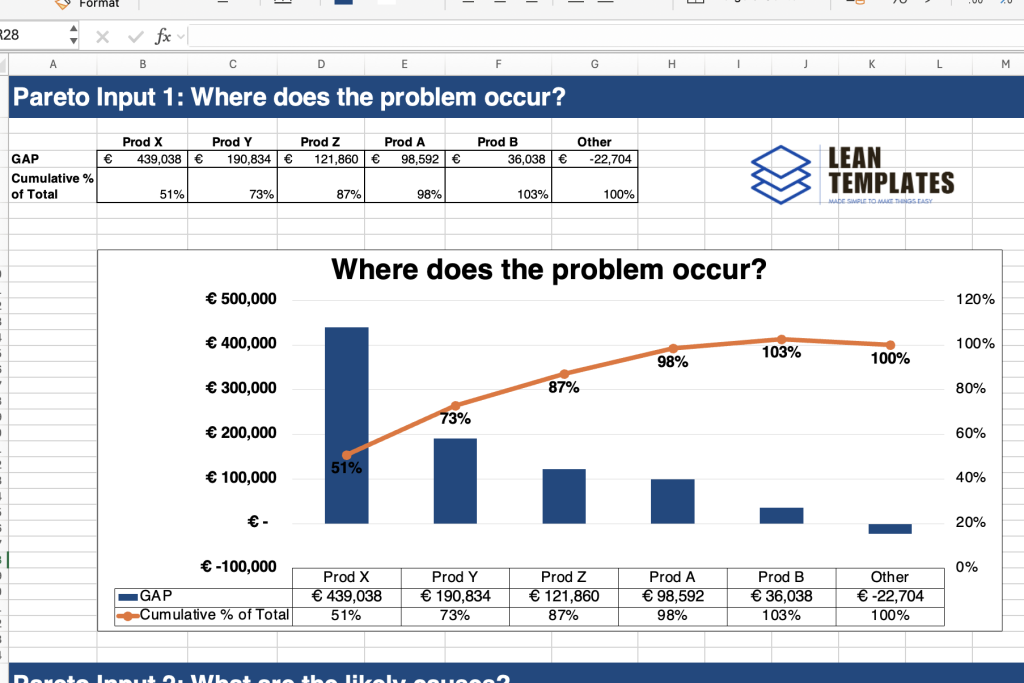
Pareto Chart Template – 80/20 Analysis for A3 Problem Solving
Easily identify the vital few with this 80/20 Pareto chart Excel template.