
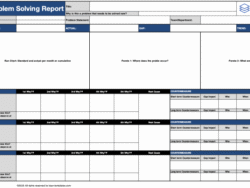
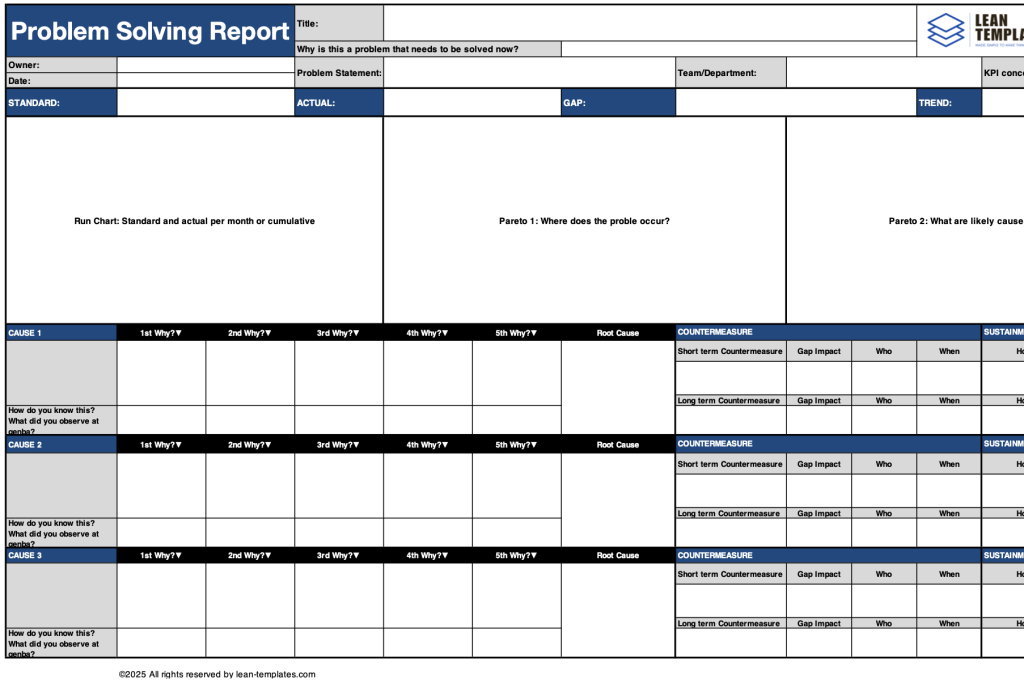
A blank A3 sheet can be daunting. Certainly because it’s double the size of a normal piece of paper. You know what is expected, you know what the sheet is for. Where do you start? Here are the most important steps of filling out the famous A3 sheet.
IMPORTANT: we all know that Problem Solving is not about the A3 sheet, it’s about the process. The purpose of the sheet is to guide your thinking, facilitate the process and mostly use it for communication with all involved. Using a standard form will help standardise the communication and ensure everyone can read an A3 Problem Solving Report.
Let’s dive in, shall we?
Header – who, what and why

The header is about setting the stage but includes some very important elements
- Title: what is the one line summary of what we’re solving here?
- Why is this a problem that needs to be solved now?: Two questions here, why and why now. It’s critical to know before you start and before you start spending time on this, why you are doing it, why it’s important and why it’s urgent. Note that importance are two different things.
- Owner: if I have questions when I see this posted at gemba, where do I go? Who leads the team through this process
- Date: how recent and up-to-date is the sheet?
- Problem Statement: this is your SAGT in a human-readable sentence. Make sure to include the Standard, Actual, Gap and Trend.
- Team/Department: who is working on this and where is gemba?
- KPI concerned: What is the overal KPI (or TTI) that we’re looking to improve? How does this relate to an L1/L2 KPI, what will the customer notice from the work we’re doing here?
- Standard: a number of what good looks like. This is the KPI you’re solving for. What is the standard, the goal or the target? A number.
- Actual: once we established where we want to be, where are we now? A number.
- Gap: what is the difference between the standard and the actual. A number.
- Trend: how is the actual behaving over time versus the standard. Usually a simple statement like ‘stable’, ‘ ‘trending down/up’ or ‘erratic’.
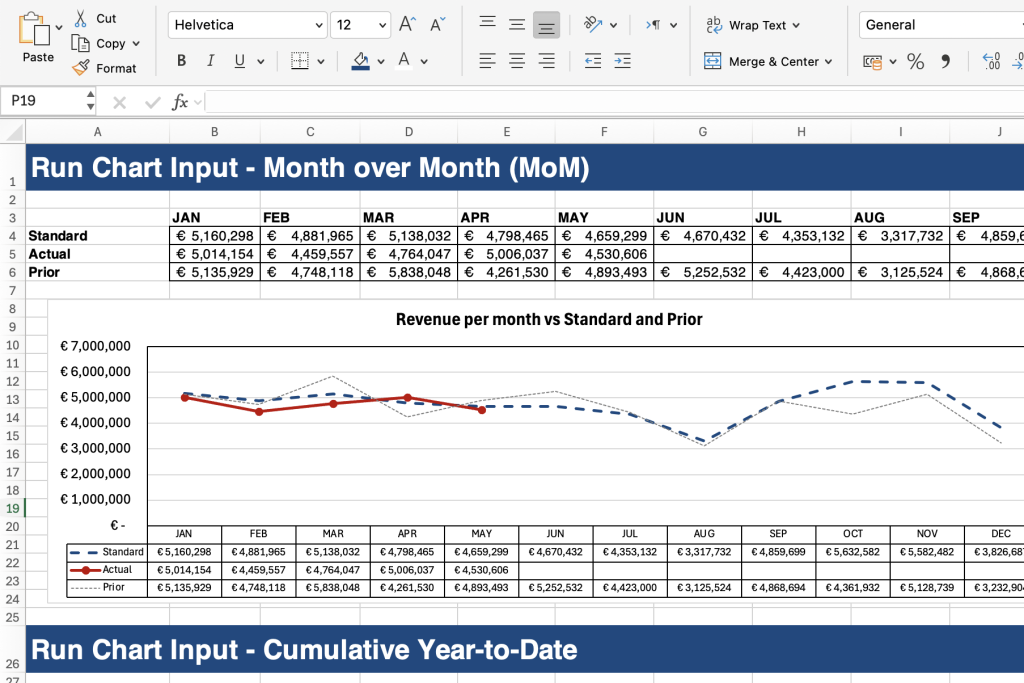
Runchart
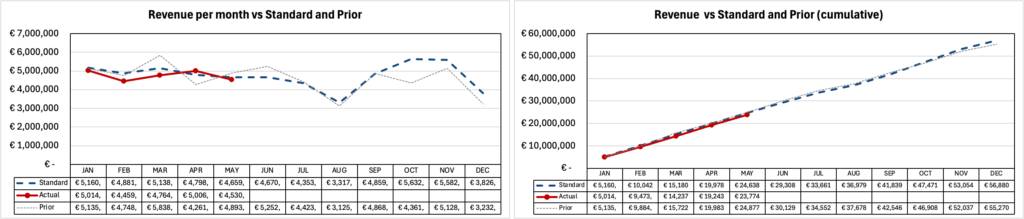
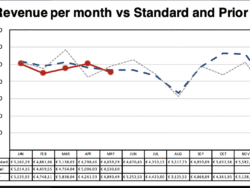
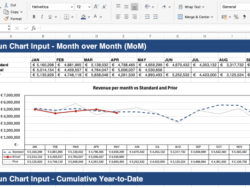
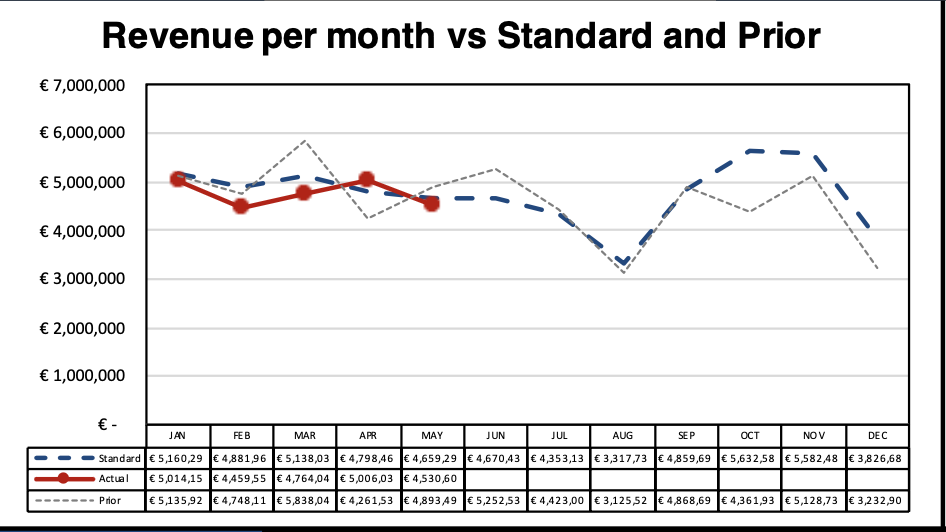
Your run chart is a graph showing how your actuals are performing versus your standard and in many cases also versus prior period (eg last year or last shift). This is to understand the gap and trend statement. Is the decline a recent thing, have we always been below standard? Are there specific moments that we miss versus the standard. As you can see above there are two
Pareto
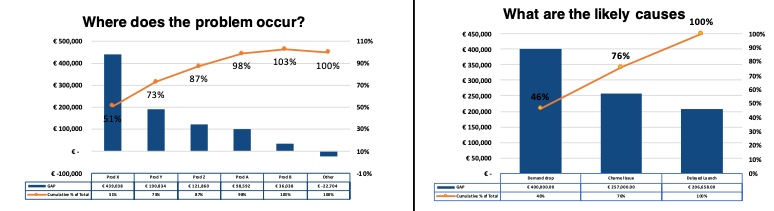
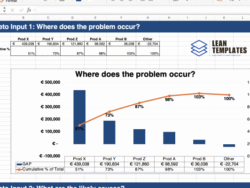
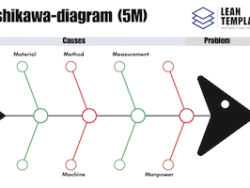
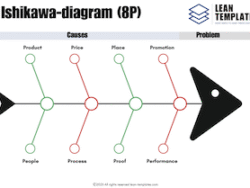
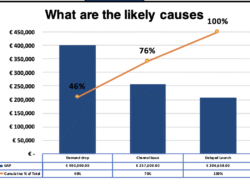
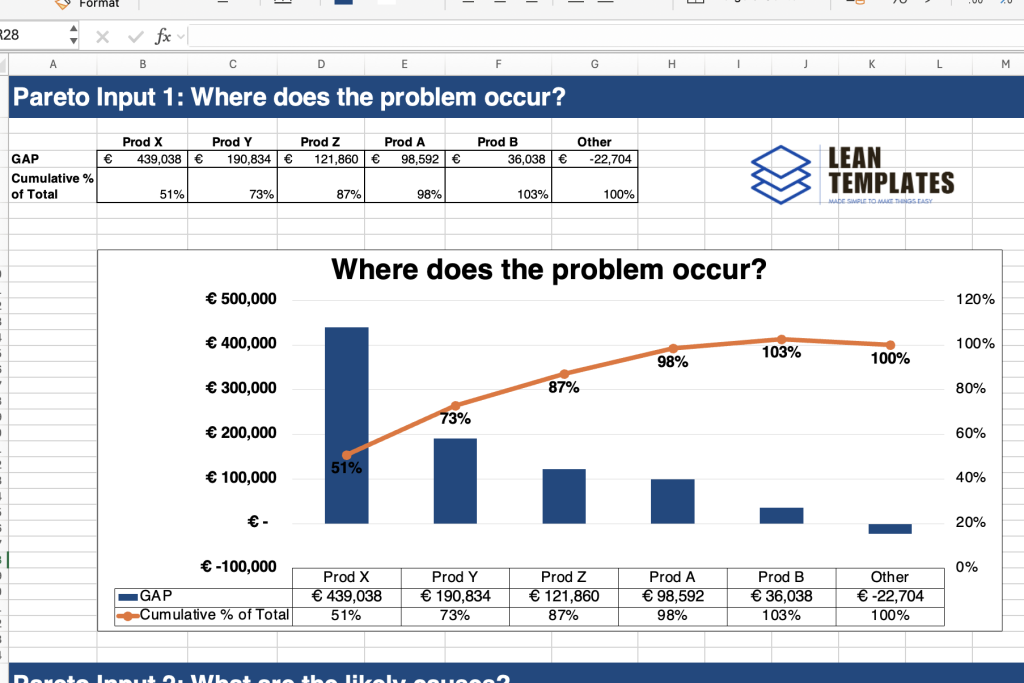
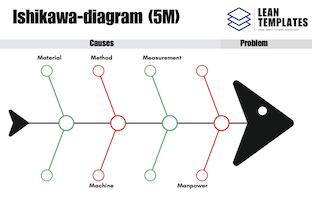
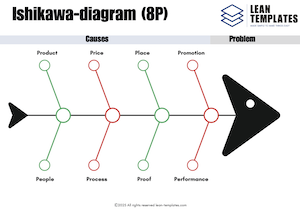
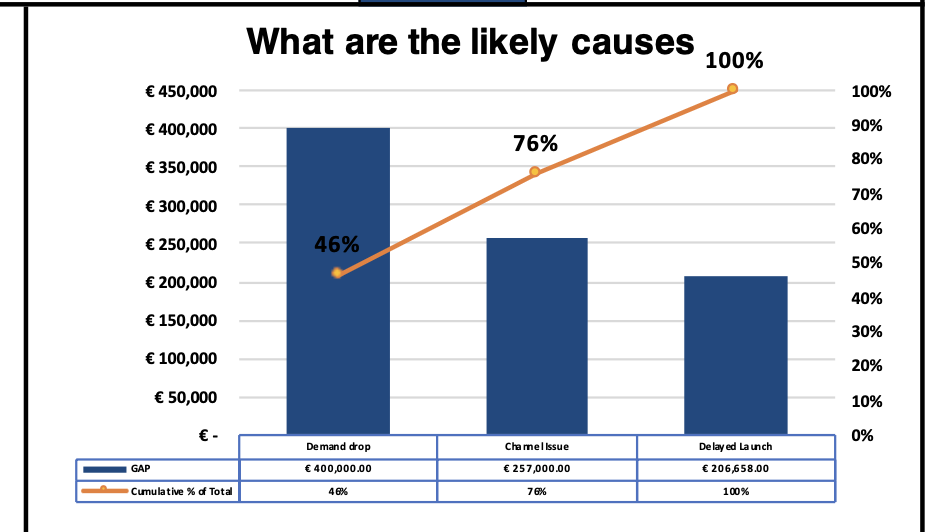
The pareto’s we use in our template are meant to break down the problem in smaller bits so we can start to build an understanding. Our template allows for two levels, to answer two questions. 1) where is the problem happening and 2) what do we believe is causing it. If you have trouble with this last question, use a fishbone or ishikawa diagram.
A pareto in its simplest form is a histogram sorted from large to small. The underlying concept, from Mr Villifredo Pareto, suggests that in many cases you will find a few big contributors (a few large bars).
Read more about a Pareto or the 80/20-rule.
5 Why’s

After having established the likely causes, the second pareto will help us prioritise which ones we should address first. Our template allows for three causes to be further examined.
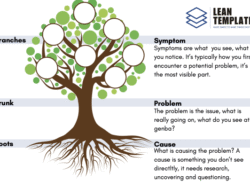
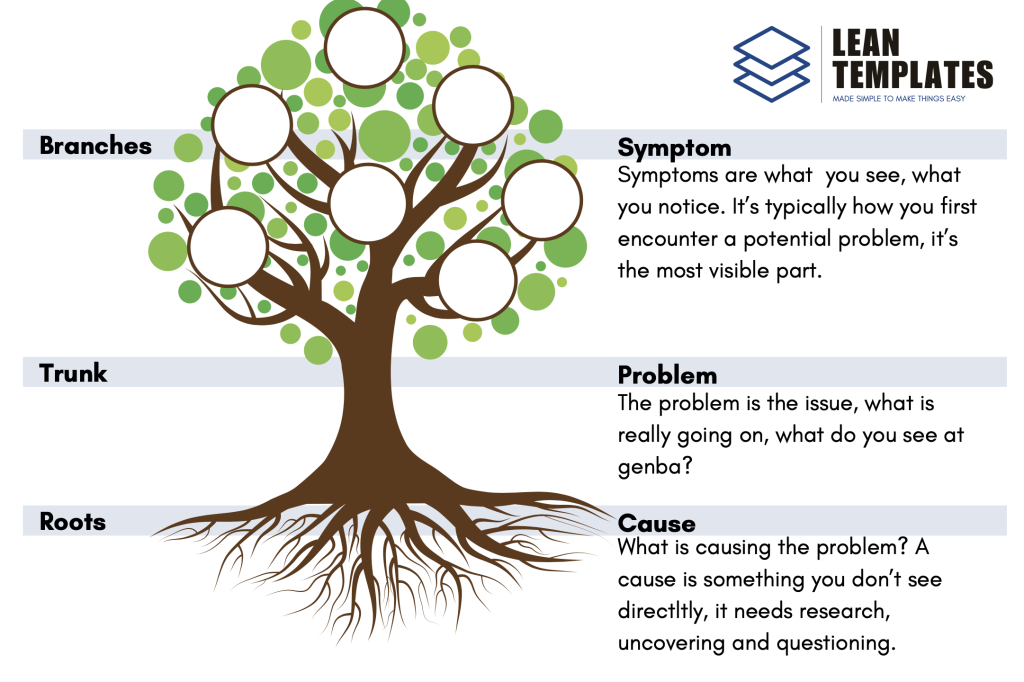
For each cause we identified, we need to research and examine the underlying rootcause. If our Pareto suggest that we are down on revenue because distributors x hasn’t bought anything this year, it’s a cause, but not a rootcause, not something we can address with a solution.
A very simple, but powerful tool here is the ‘5 why’s’. Bring some childlike curiosity to your problem and ask “Why is xx happening?”, formulate an answer and then question the answer. Repeat 3 to 5 times and there’s a good chance you’re at rootcause.
Countermeasures
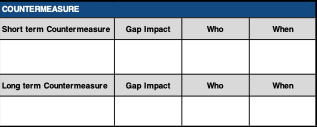
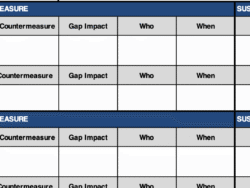
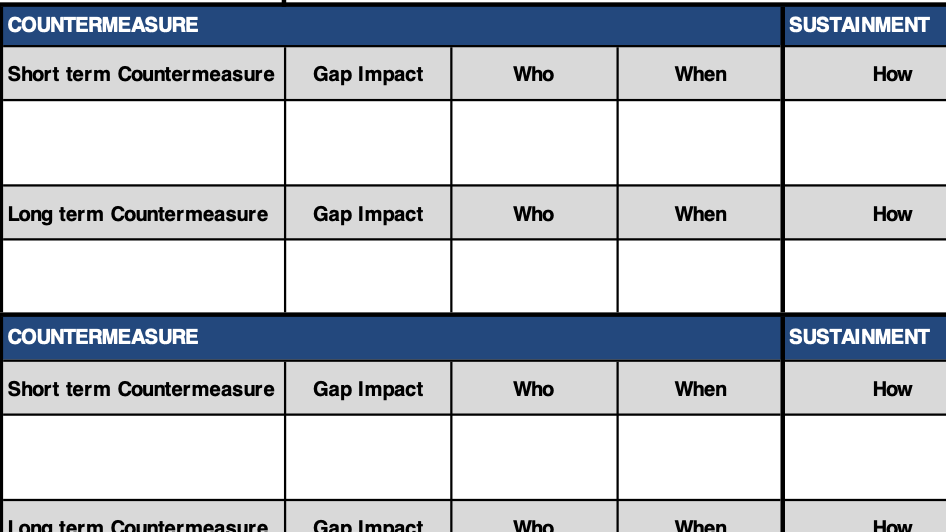
There’s a rule of thumb that says that the more time you spent on defining the rootcause, the easier it is solve for it. In our template we ask you think about the short term and long term countermeasure to your root cause. A short term countermeasure is an action you take that immediately will ‘stop the bleeding’. It’s a temporary thing to ease the pain, a band aid. You do this while you build and implement your long term countermeasures.
A long term countermeasure is the final solution that makes the root cause go away once and for all. It typically is a longer/bigger action that requires time and resources. The best long term countermeasures are embedded into new processes, new ways of working and includes training. Just to make sure you address the whole thing everywhere.
Sustainment
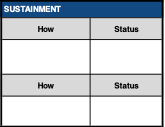
Sustainment is the last part of the template and it’s a very important piece. It’s a step in the process that will force you think about and spell out how you will sustain all improvements and counter measures your taking. Here you will describe how you will ensure in the next 30/60/90 days that actions are implemented, new processes are followed and you are actually closing the gap.
Just to prevent you’re in the same boat again next year.
A3 Problem Solving Template Bundle
The complete toolkit for structured problem solving in Lean. Includes editable A3s and ready-to-print PDFs.