If the same issue keeps resurfacing, chances are you’re tackling symptoms instead of addressing what’s really driving the problem. That’s where the fishbone diagram comes in — a straightforward visual method to uncover underlying causes rather than settling for quick fixes.
Below you’ll find what a fishbone diagram is, when to use it, and how to build one yourself.
1. What Is a Fishbone Diagram?
A fishbone diagram—also known as an Ishikawa diagram or cause-and-effect diagram—helps teams explore and categorize potential reasons behind a defined problem.
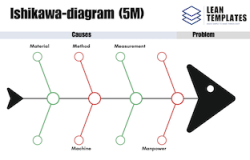
The layout looks like the skeleton of a fish:
- The head represents the problem statement
- The bones show groups of possible causes
Common cause categories include topics such as People, Process, Equipment, or Materials.
The technique was developed in the 1960s by Japanese quality expert Kaoru Ishikawa, and remains popular in Lean, Six Sigma, and other continuous-improvement frameworks.
2. Why Use a Fishbone Diagram?
A fishbone diagram helps teams step back and look beyond surface-level issues.
Key benefits:
- Brings structure to analysis: Everything is captured visually so nothing gets overlooked.
- Encourages collaboration: Cross-functional teams can share insights from different angles.
- Avoids band-aid fixes: By digging deeper into causes, you’re more likely to prevent the problem from returning.
3. How to Make a Fishbone Diagram
Step 1 — Clarify the problem
Write a concrete, measurable statement.
Example: Instead of “quality issues,” try “20% defect rate over the past quarter.”
Step 2 — Draw the structure
- Sketch a long horizontal line (the “spine”)
- Place the problem statement at the end (the “head”)
Step 3 — Add cause categories
Create angled branches off the spine. Common categories include:
- People: Skills, behaviours, training gaps
- Process: Missing steps, unclear instructions
- Materials: Poor quality, inconsistent supply
- Technology/Equipment: Breakdowns, outdated tools
- Environment: Regulations, market conditions
Step 4 — Brainstorm causes
Ask “Why is this happening?” repeatedly, drilling down into specifics. The 5 Whys method is especially helpful here.
Step 5 — Identify the root cause(s)
Review all input and determine which potential causes drive most of the problem. These are your candidates for corrective action.
4. Tips for Effective Use
- ✅ Bring in people with different backgrounds
- ✅ Use real data wherever possible
- ✅ Keep asking “why?” to push deeper
- ❌ Don’t accept symptoms as root causes
- ❌ Avoid vague or loosely defined problems
- ❌ Don’t add unnecessary detail — clarity beats complexity
5. How It Fits Into Lean Problem Solving
Within Lean, the fishbone diagram is a practical tool to explore cause-and-effect relationships. It pairs nicely with A3 problem solving and the 5 Whys, helping teams understand a challenge before selecting countermeasures.
Think of it as a structured starting point before defining actions.
6. 5M vs. 8P Categories
There are two widely used category sets. Your choice depends on the context.
✅ 5M (Typical in Operations & Manufacturing)
- Man (People) – skills, staffing, training
- Machine – tools, equipment, technology
- Method – process instructions, standards
- Material – input quality and availability
- Measurement – data errors, inaccurate KPIs
Best for production environments or operational workflows.
✅ 8P (Often used in Services & Commercial Roles)
- Product
- Price
- Promotion
- Place
- People
- Process
- Physical Evidence
- Performance
Helpful when analyzing service delivery or customer-experience challenges.
7. Ready to Create Your Own?
Want to try it for yourself?
I’ve put together a free fishbone diagram template you can download and use right away.
5M Ishikawa Fishbone Diagram Template – Root Cause Analysis in Manufacturing
Quickly identify root causes with this printable 5M Fishbone template, designed for Lean problem-solving.

8P Ishikawa Fishbone Diagram Template – Root Cause Analysis for Service, Sales and Marketing
Go beyond manufacturing. Use this 8P fishbone template to analyze service and commercial problems effectively.