Use this Excel run chart template to display KPI trends, performance data, or improvement metrics over time.
- Great for identifying shifts, cycles, and variation patterns.
- Ideal for Lean Daily Management and operational reviews.
- Simple, visual, and ready for your next team meeting.
This template includes two options:
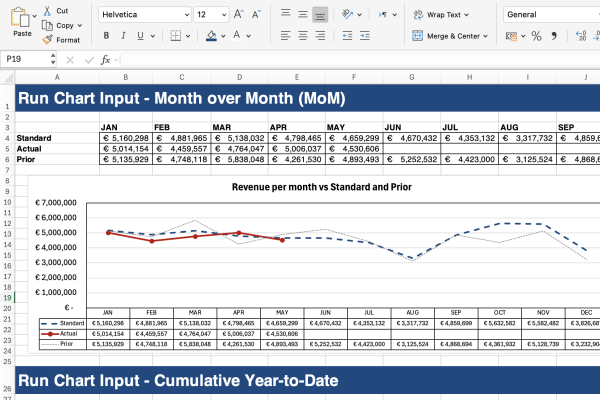
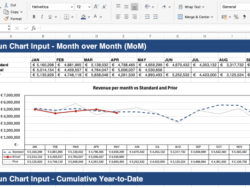
1. Month by Month performance:
This view helps seeing trends over time and to assess anomalies and whether they’re random or systemic.
2. Cumulative performance:
This visualization of KPIs helps visualizing the YTD (cumulative) GAP. When adding a forecast line it can even suggest where the gap will be at the end of the years. It can also show impact or counter measures during the year.
Note: both graphs will automatically populate when inserting the data. In this way you can easily decide which chart to use.
When to use run charts:
- As part of visualizing performance in monthly reviews
- To quickly identify trends as part of Daily Management
- When describing a problem (gap) as part of A3 Problem Solving
Reviews
There are no reviews yet.