Bowler KPI Report Template – Visual Performance Tracking
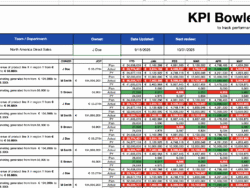
Unlock sharper insights at a glance with our Bowler KPI Report Template—the Lean-friendly Excel tool designed to make performance tracking effortless. With vivid red and green conditional formatting, your team can instantly spot trends, deviations, and successes against monthly KPIs.
This template streamlines daily management, strategic execution, and KPI reviews with:
- Clear visual cues for quick performance identification
- Automatic trend highlighting, so issues aren’t overlooked
- A focus on data-driven conversations and continuous improvement
Turn raw numbers into actionable discussions, drive accountability, and make your performance tracking both intuitive and impactful.
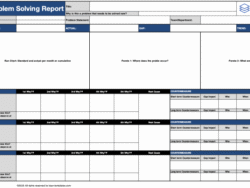
💡 Seeing too much red, considering starting your A3/Problem Solving journey.
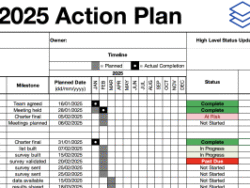
💡 Looking to track your strategic initiatives as part of Strategy deployment, look here.


Reviews
There are no reviews yet.